IELTS Writing Task 1 | The average speed of urban zone traffic (2 Tables)
Task 1 | Essay 4
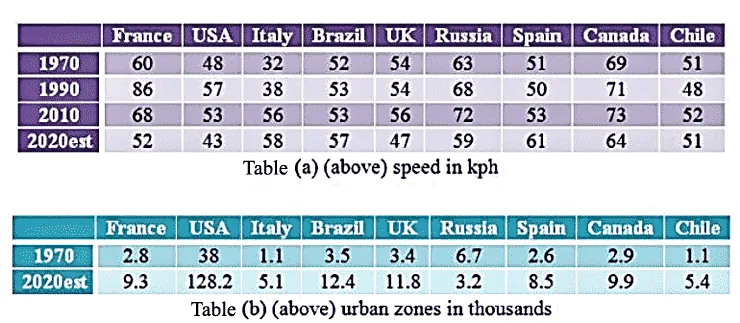
The tables show (Table a) the average speed of urban zone traffic (in kilometres per hour or kph) in a number of countries over a fifty-year period, including a future estimate; and also (Table b) the total number of urban zones per country (in thousands).
- Summarise the information by selecting and reporting the main features, and make comparisons where relevant.
How to answer this essay?
- Introduce the table.
- The Task presents a complex set of data, which could be described in several ways. You can take the logical approach to grouping, and introduce the first data group (“the general trend is for the speed to increase and then decrease”) giving data to illustrate it.
- Write the main body paragraphs.
- You can use a separate paragraph to explain why Chile is an exception (“remains static”) and then explain why Italy, Brazil and Spain are a separate group (“show a clear rise”). You can show that you can notice the trend (“increases of roughly 4 times”) and the exception (Russia).
- Write the summary sentence and check your work.
- The summary sentence is one of a number of possible options. You can use paragraphing and signposting significantly to make the essay clear and to identify the different groups, despite the large amount of data present.
Model Answer | Marked as Band 8
Cohesive connecting words that improve coherence in writing . Useful less common words that boost fluency in writing .
- The tables show the average velocity of city traffic over a fifty-year timescale, with a forecast for the future, and also the number of urban zones by country.
- We can see that the general trend is for the speed to increase and then decrease. For example ,in France, it increased from 60 kph in 1970 to a peak of 86 kph in 1990, tailing off to a forecast 52 kph in 2020. Similarly , we see the USA peak at 57 kph in 1990, declining to 43 kph at the end. The UK and Russia have a similar trend, rising to 56 and 72 kph respectively in 2010 before falling to below the starting level. The same happens in Canada with a decline from 69 kph to 64 kph despite a peak of 73 kph.
- Chile, however , fluctuates around 51 kph, but remains static over the period. Italy, Brazil and Spain, by contrast , show a clear rise, finishing at 58, 57 and 61 kph respectively. Regarding urban zones, all countries except one see predicted increases of roughly 4 times by 2020. The exception is Russia, which sees a fall of about half to 3,200.
- Overall , the data does not suggest any correlation between increasing urban zones and average traffic speeds.
208 words
0 comments
You must login to post comments!