IELTS Writing Task 1 Sample Essays for Practice
Explore IELTS Writing Task 1 Sample Essays
The table below gives information about the underground railway systems in six cities.
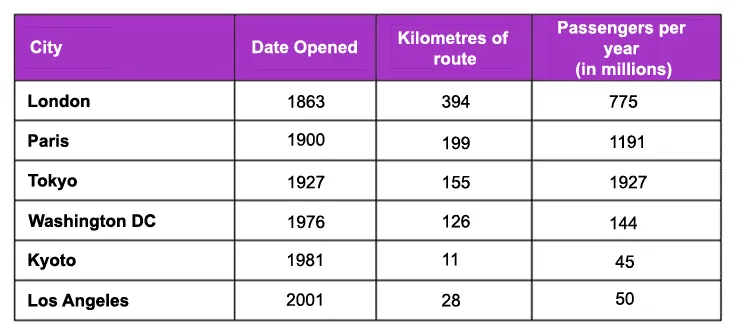
- Summarise the information by selecting and reporting the main features, and make comparisons where relevant.
The table below gives information about the daily cost of water per person in five different countries. (Figures are based on the minimum daily requirement per peron of 11.5 litres.)
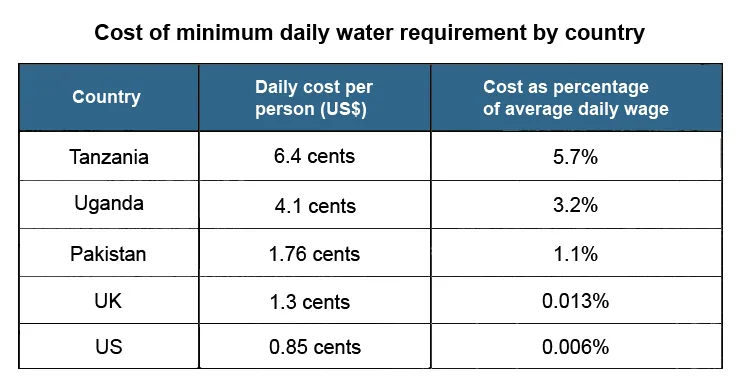
- Summarise the information by selecting and reporting the main features, and make comparisons where relevant.
The table shows the percentage of people with mobile phones who use various features on their phone between 2006 and 2010.
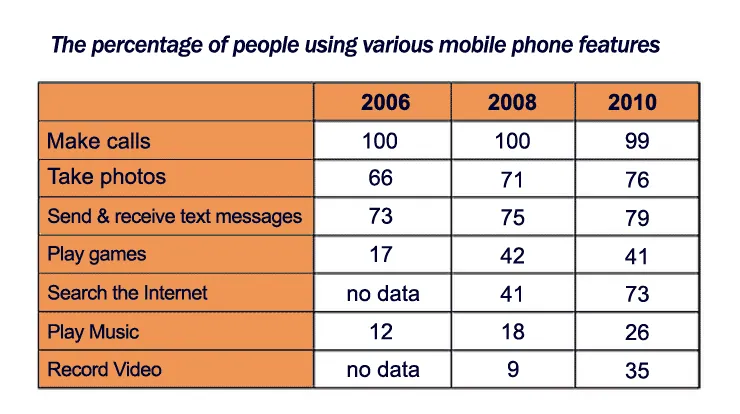
- Summarise the information by selecting and reporting the main features, and make comparisons where relevant.
The tables show (Table a) the average speed of urban zone traffic (in kilometres per hour or kph) in a number of countries over a fifty-year period, including a future estimate; and also (Table b) the total number of urban zones per country (in thousands).
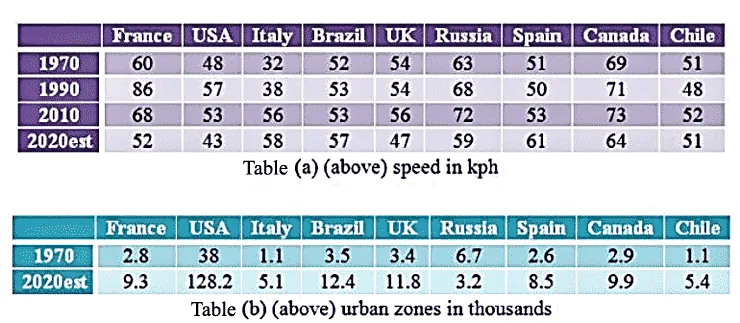
- Summarise the information by selecting and reporting the main features, and make comparisons where relevant.
The tables below give information about the amount of exports (millions of tonnes) moving through Rotterdam port in Holland to various global destinations in 2002 and 2012; and also, the % rates of tax imposed on these exports by the receiving countries.
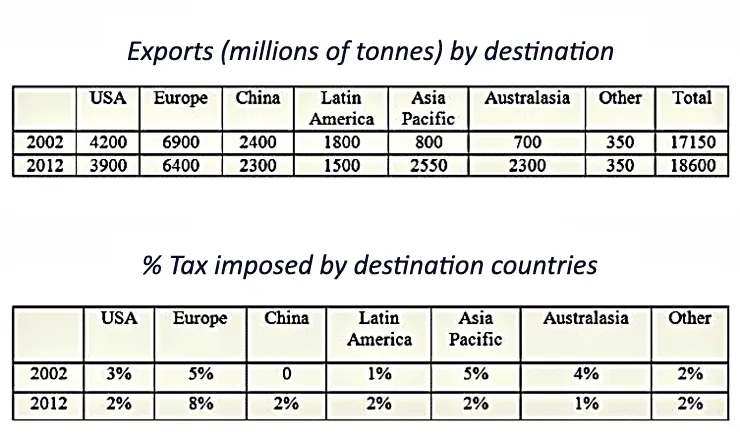
- Write a report for a university lecturer describing the information shown below, and make comparisons where relevant.
The tables below show data about the amount of television watched by children in different countries (hours per day) and also the average academic achievement of people in these countries (% of people completing each level).
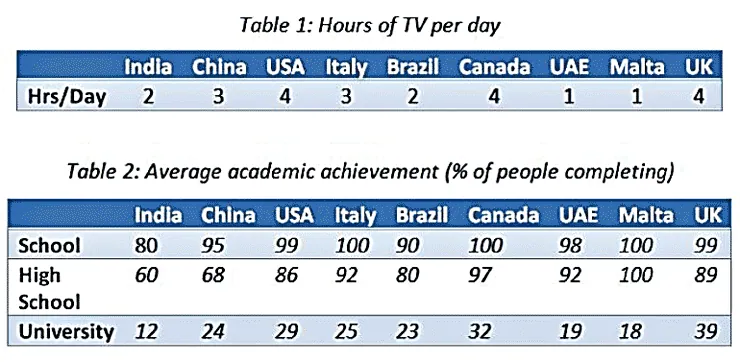
- Write a report for a university lecturer describing the information shown below, and make comparisons where relevant.
The graph shows average annual expenditures on cell phone and residential phone services between 2001 and 2010.
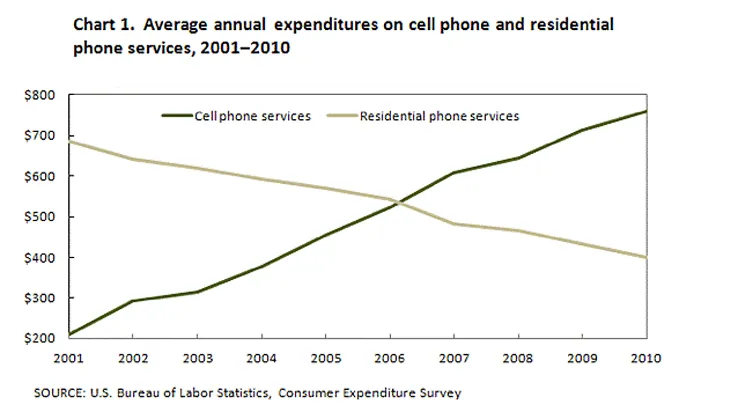
- Summarise the information by selecting and reporting the main features, and make comparisons where relevant.
The bar chart shows the number of visitors to three London Museums between 2007 and 2012.
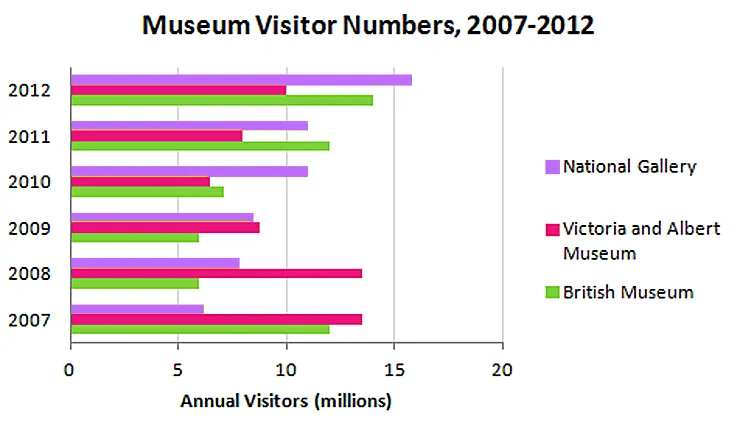
- Summarise the information by selecting and reporting the main features, and make comparisons where relevant.
The pie graphs below show the result of a survey of children's activities. The first graph shows the cultural and leisure activities that boys participate in, whereas the second graph shows the activities in which the girls participate.
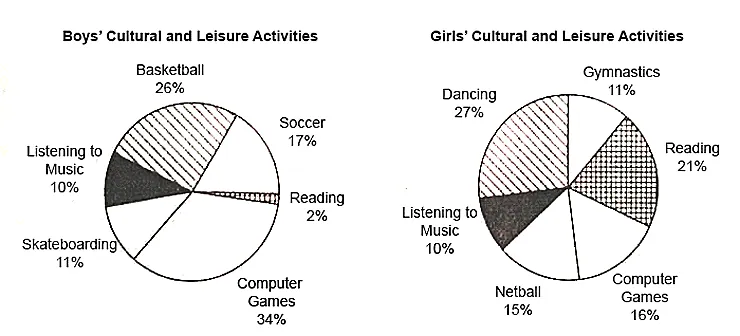
- Write a report describing the information shown in the two pie graphs.
The first graph below shows the weight (in tonnes) of fruit produced by a farm during each month in 2013, and also the amount (in tonnes) of fertiliser used. The second graph shows the volume of rainfall in each month (in millimetres).
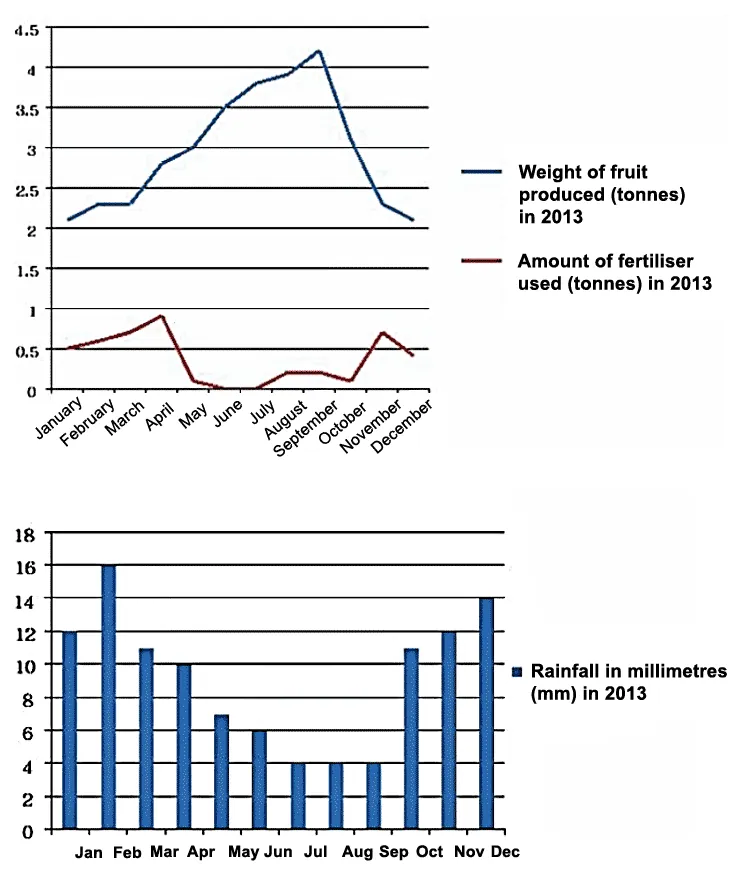
- Write a report summarising the information. Select and describe the main features, and make comparisons where relevant.
The first chart below shows the number of airline crew (pilots, stewards etc) needed to fly a passenger plane between Australia and a number of other countries. The second chart shows the number of passenger complaints per plane journey made on these routes, and average kilogram (kg) weight of luggage (or baggage) carried per passenger.
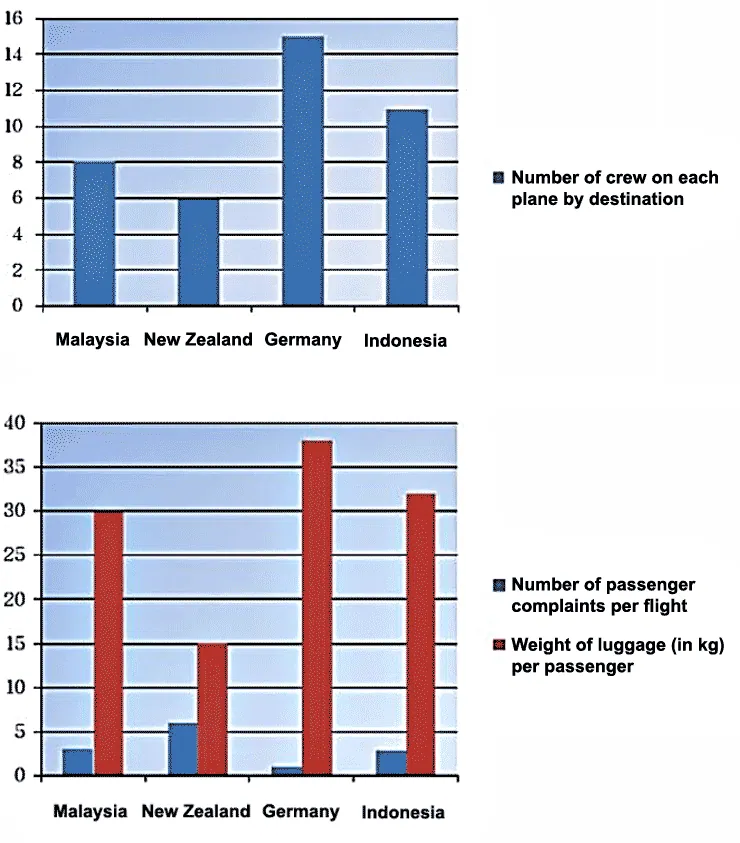
- Write a report summarising the information. Select and describe the main features, and make comparisons where relevant.
The plans below show a public park when it first opened in 1920 and the same park today.
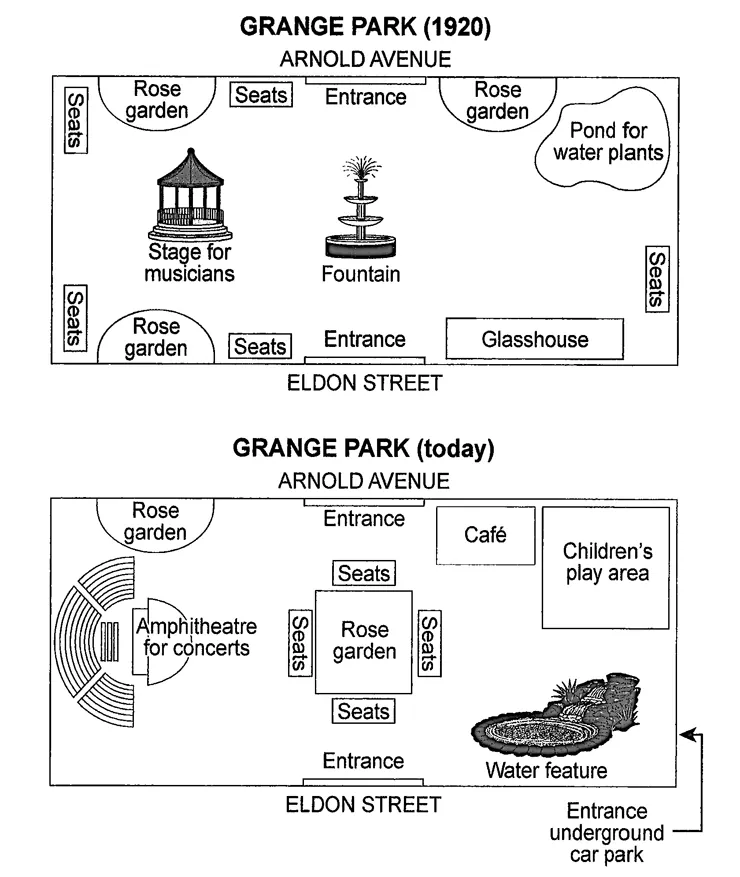
- Summarise the information by selecting and reporting the main features, and make comparisons where relevant.
The table below shows the numbers of visitors to Ashdown Museum during the year before and the year after it was refurbished. The charts show the result of surveys asking visitors how satisfied they were with their visit, during the same two periods.
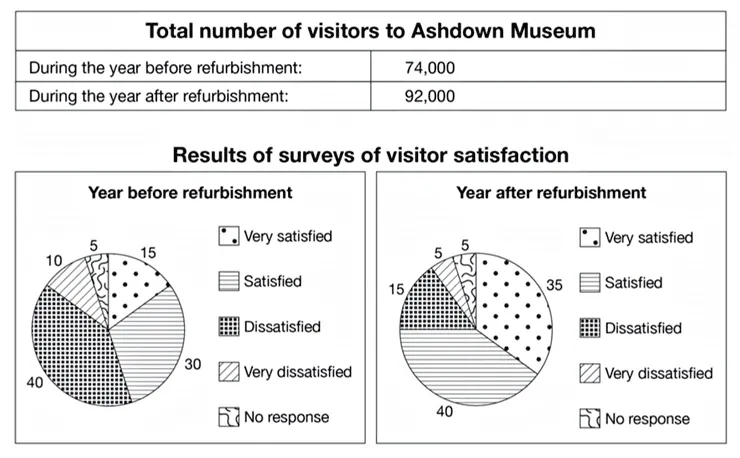
- Summarise the information by selecting and reporting the main features, and make comparisons where relevant.
The diagrams below show a picture frame and front view of other two picture frames.

- Summarise the information by selecting and reporting the main features, and make comparisons where relevant.
The diagrams below show the life cycle of a species of large fish called the salmon.
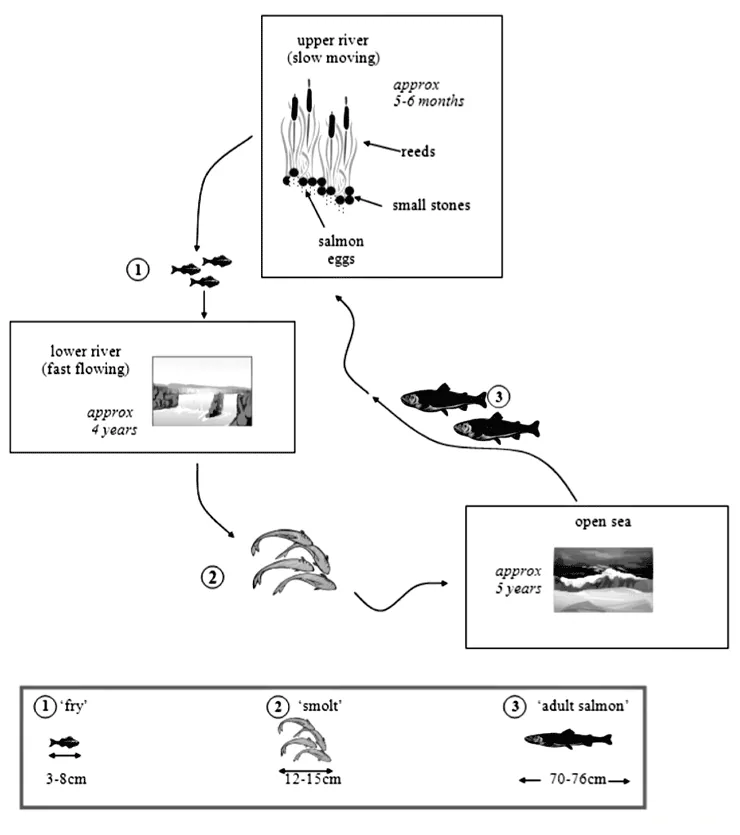
- Summarise the information by selecting and reporting the main features, and make comparisons where relevant.
16 comments

Parinaz TavanaMar 09, 2024
Your samples are great

Raza NaqviApr 08, 2024
Thanks for the great website to practice. I want to ask if there are questions listed as in reading and listening from the Cambridge book?
Azita KaramiFeb 17, 2024
Thank you , no example for writing task 1 genaral?
Meysam SabriAug 02, 2024
That's very useful.
Tengsy ThomasApr 12, 2024
EXCELLENT
Aryan KazemiJun 11, 2024
WE need more sample about GT IELTS writing .therefore,I FEEL some sort of discrimination between academic and gt candidate resource availabilities in here, am i wrong?
Marianne YazdaniOct 05, 2024
Uhhhhh you generous and kind site providers!!! you update the site it's amazing!!! thank you for helping us really! I use your website for my list and rea skills everyday and I became a master in them just because of your amazing website!!! at the beginning I was stocked on 6 band score in lis and 6 read but at the moment I'm mostly achieve 8 8.5 in list and 7 7.5 in read!!!! I appreciate all your hard works and favoures<3 you are the best*****
This is our pleasure, Marianne. You're welcome. We wish you good luck!
Gazi AllieAug 13, 2024
Make a listner to upper left corner image to reach the home ]
Nihat GuliyevNov 10, 2024
Salam aleykum Allah sizi qorusun
Jugurta BoudjitMar 01, 2025
Thank's a lot, really you're the best
You're welcome.
Ibrahim NzundaMar 04, 2025
I was sometimes confused just looking how hard the posted questions was, but after following your techniques and clues I found myself having good confidence to solve all the questions I might be facing to the ielts exam. thank you so much, you do a wonderful job to help us.
This is our pleasure. Good luck!
Muhammad Waqas TariqFeb 16, 2025
Are there any practise tests for general writing ?
Tahira JabeenMar 06, 2025
Can we also write an essay on this site and get scoring ?
KomalpreetMar 17, 2025
Can you please help for GT Writing?
Arif RahmanJun 18, 2025
Requesting something for GT in writing Task 1?
Farzad NurJul 01, 2025
Can't I write the answer to these questions and get an evaluation like the listening and reading module?
You must login to post comments!